As I mentioned earlier, here's the latest google analytics data over the period that I've been logging.

The above image shows a figure for the total number of hits tracked for each page or screen in the app that a user can look at. Although there are only a number of activities or screens that are re-used in the app implementation, when ever the data for a different game type it is tracked as if it were a separate page on a website.

The above chart shows the game results look up relative to each other game type. Lotto is a clear dominator.
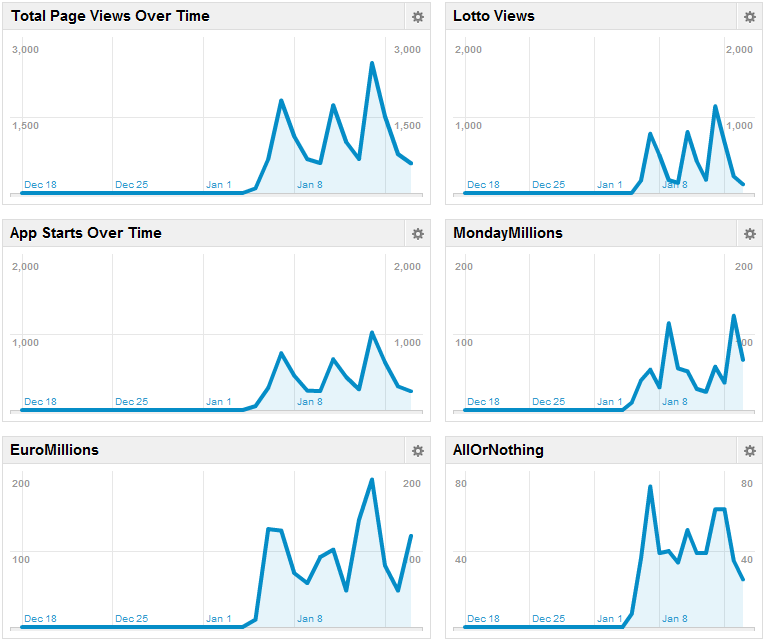
These graphs plot the number of page tracks over time which is interesting, as a clear trend of when people actually use the app can be seen. If you note that the graph spike on Wednesdays and Saturdays for the Irish lotto. EuroMillions turns up on Fridays, however interestingly people checked Euro Millions results more on Saturday. The number of people visiting each page actually reflects pretty I think on how many people play each game from my experience selling lotto in my previous retail job.

The last image is the live tracking section of google analytics. This is the most I've witnessed people using my app at a single point in time, although it's entirely possible that there have been more people using it at once and I just hadn't seen it. It's interesting watching as individual clicks on pages scroll across the screen in real time. Obviously it's better to see in video format than a still image, as the interface is animated.
No comments:
Post a Comment